Most Windows 8 (or 8.1) users would look at the apps on their start screen and assume that they couldn’t build one themselves. Many people would be wrong, as Microsoft’s Project Siena app sets out to help those people who’d like to build an app but have almost no development skills. If you understand the data you might be working with, that’s an advantage, as is a good knowledge of Excel function syntax. So what is Project Siena?
Project Siena is itself a Windows 8.1 app which generates other Windows 8.1 apps. The apps can be basic screens with static text and images, or can be more complex with multiple ‘screens’, data queries and actions. I would also describe Project Siena as a good tool to generate a prototype app or visualisation of something more complex that you would build in Visual Studio.
The starting point in Project Siena is a blank ‘screen’, but behind the scenes you can create a data connection – supported sources are:
- Excel
- Azure Mobile Services
- REST
- RSS feeds
- SharePoint lists / libraries
Once a data connection is created you can preview the data, and then use it within the visual elements that you place into the app – type-ahead and syntax prompting make this easy to do. There’s a good selection of visual elements to add:
- Labels and input text
- Buttons
- Images
- Sliders
- Galleries
- Video and audio player
- Camera, pen and microphone inputs
- Toggle switches, radio buttons and checkboxes
- Listboxes and drop-down lists
- Ratings
- Shapes
- Timer control
- Import and export
In most cases there are options for these elements (e.g. colour, size and formatting for a text label). There are also behaviours, depending on what the element is (e.g. a button could allow you to navigate to another screen, a slider could set a value).
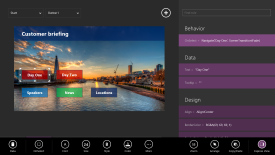 To get a better idea of how Project Siena works, let’s take a look at a sample app I’m working on. The scenario is to build an app that holds the details of a customer briefing – the agendas, details of the speakers, technology news and briefing centre locations. The opening screen has five buttons for navigation (click on the small images to see the larger versions). I have added five additional screens, and these buttons navigate to them – this is simple to do, I select the button, state that the action when the button is clicked (or touched) is to navigate, and then Project Siena asks which screen we will navigate to and what will the transition look like (fade, cover or uncover). Of course, it will be good practise to place a button or arrow on the child screens to navigate back to the home screen.
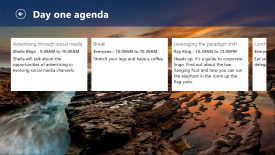
What I’ve also done for this app is to set up a data connection, and to make it easy for the demo I’ve used some Excel tables. One of these Excel tables contains agenda details – session titles, speaker names, times, and details of where speaker photos are located. Using these details I’ve set up browsing of the agenda with two looks. The first uses a gallery, which is like a repeating set of horizontal or vertical panels displaying the data. The text for each piece of information can be displayed simply by referring to the data connection and the data item within the table. You can add some flexibility to data queries by filtering and by showing unique items – so in another example I’m working on I’m querying a larger table, getting values into one list box and then refining the values in the second and third list boxes by my choices. This is where the Excel-like syntax comes in handy, but it’s really not coding.
Back to the customer briefing example, the other way in which I’ve displayed the agenda is to create a listbox to list the sessions, and then clicking on a session shows me the speaker’s name and title, the time of the session, a description and the speaker’s photo. Again, easy stuff, all point and click – I’m just looking up values from one record based on the selected value in the sessions listbox.
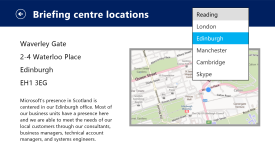
The day one agenda above shows a text-only gallery, but you can also create a gallery containing images (see below). Finally, a screen displaying the briefing centre locations. Again, the data is stored in Excel, and the choices are provided in a drop-down list (I could have used radio buttons). Like the day two agenda example, the text box contents and the images are looked-up based on the drop-down list selection.
When the app is finished it can be published, and that final process allows you to design an icon for the Windows 8.1 start screen.
This has been a look at the Project Siena basics and a simple app, but next time we’ll look at something a bit more complex. In the meantime you can see some other example apps here.




when will this be avaialble to the public?
The Beta is already available in the Store.
http://microsoft.com/en-us/projectsiena/default.aspx
Also, there will be an update soon (within the next month I think) and that will add some extra support for REST and some other improvements. I don’t know whether that update will move it from beta to version 1.
Beta 2 version of Microsoft Project Siena was released on 3/24/2014. This is also a free download through the Windows Store. http://apps.microsoft.com/windows/en-us/app/microsoft-project-siena/5ae47651-e8f3-4e41-aab7-e19ab1b80180
Expecting V1 later in the year.