
In two recent posts I discussed the Power BI app for Windows 8.1 and Power Query for Excel 2013. Continuing with this business intelligence (BI) theme, let’s take a look at Power BI for Office 365 (and to make it less of a mouthful, I’m just going to refer to it as Power BI).
The post about the Power BI app described the way that Excel files may have ‘presentable’ BI content, and the same applies here. If you create an Excel spreadsheet containing a Power View dashboard (or dashboards), Power BI will recognise this and focus on it as content to display. It should also be mentioned that the data is not necessarily stored in Excel – it could exist in a database or system, and Excel services on the server are being used to query and present the data.
So what is Power BI? It’s an add-on entitlement for Office 365 that will provide an attractive presentation interface for your dashboards. The Excel files containing the dashboards can live in your OneDrive for Business collection or in SharePoint sites. Power BI can be added to the sites to provide that presentation and navigation capability. It also provides some other capabilities, but we’ll come to those later.
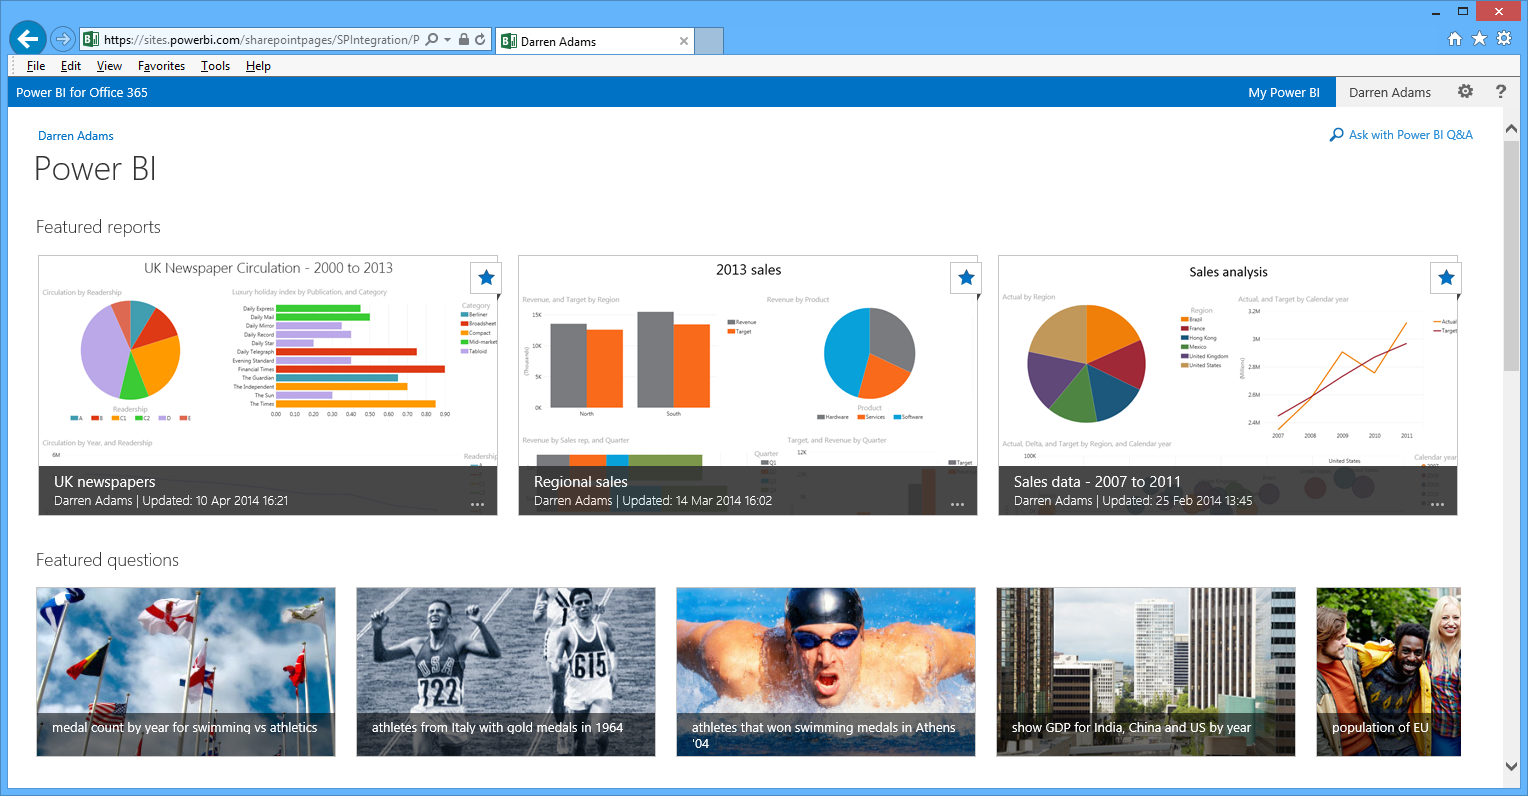
How does it work? As I mentioned, if you have entitlements to Power BI, the capability can be added to your SharePoint site. By navigating to the Power BI section of that site you will see a representation of the folders and Excel files in the site’s document libraries. A file can then be ‘enabled’ and this makes it ready to go into the Power BI gallery (by marking it as a featured report). At this point the file’s visual place-holder will show a snapshot from within the file, and it if contains a Power View dashboard then you’ll see a preview of this. The image below shows a number of Excel files enabled and added as featured reports.
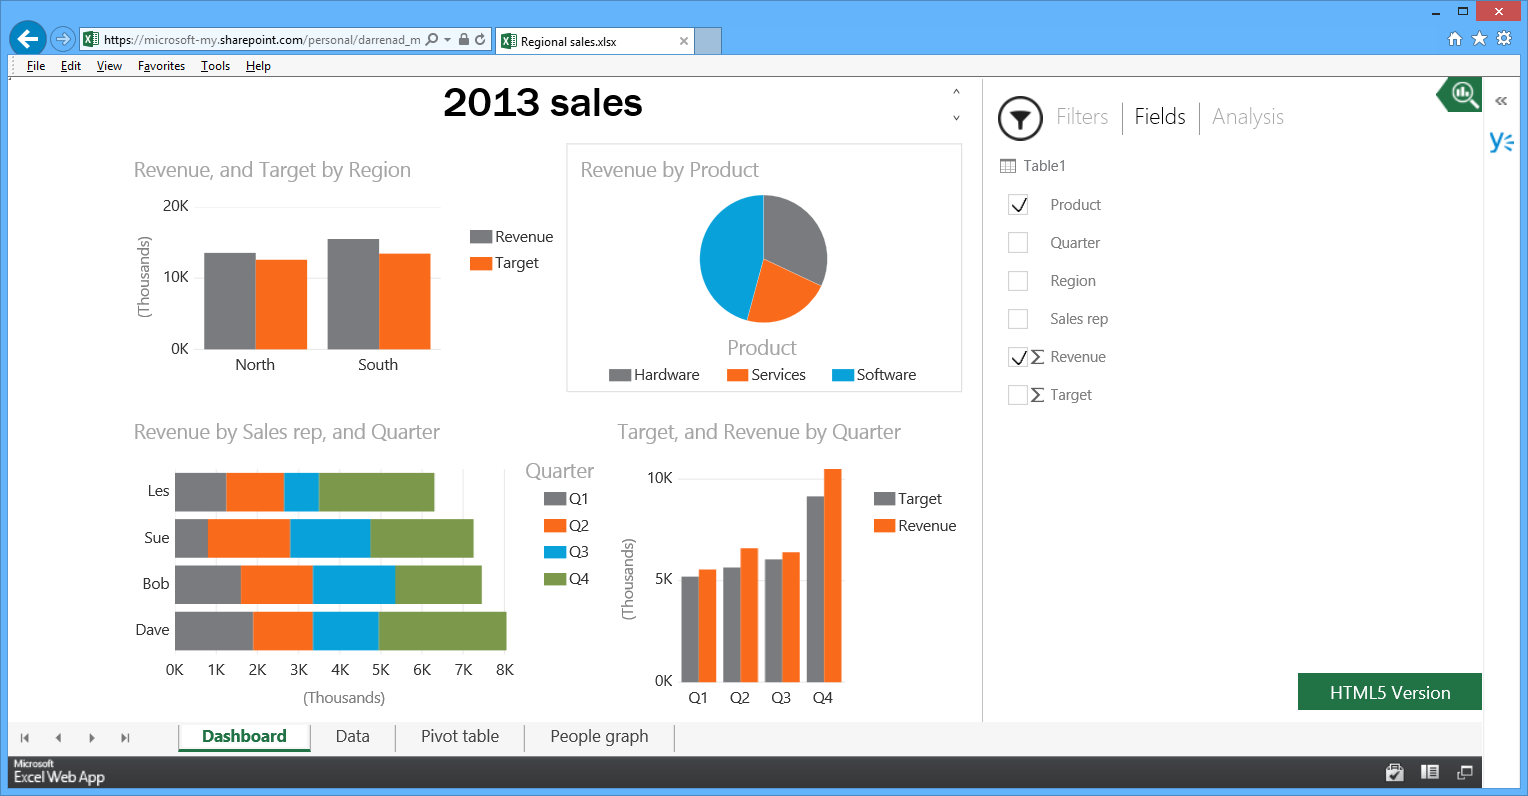
From here it’s simply a matter of clicking on the report to view it. As with Power View in Excel itself, or the Power BI app, the dashboards can be explored, drilled-down and filtered. Fields can be added and removed, and chart types can be changed. Power BI can display the dashboards via HTML5, and therefore it will work on a variety of modern browsers including those on some of the popular tablet devices.
I mentioned that Power BI provided some other capabilities beyond providing navigational access to reports. One is that it removes the file size limit given to Excel files sitting in SharePoint document libraries and viewed using the Excel web app – this will allow you to view and explore some big ol’ chunks of data.
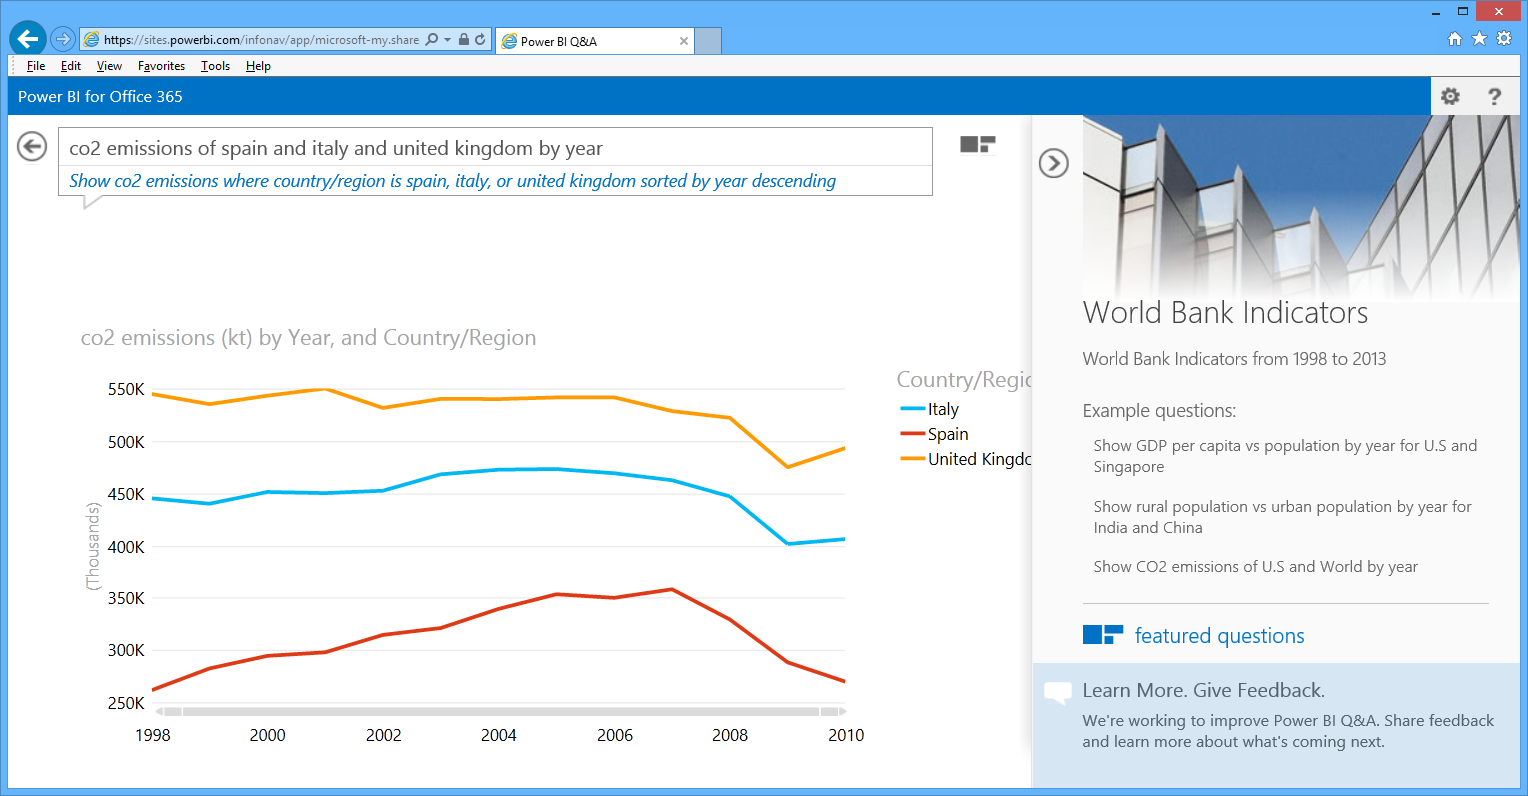
Another capability of Power BI is the natural language ‘Q&A’ feature. In a nutshell this allows you to use natural language to generate a view of the data. Excel files have to be made ready and optimised for this type of analysis, but it’s a simple one-minute step. You can add ‘phrasings’ – this is useful for allowing people to use words which aren’t in the original data definition but which they are likely to use to query the data (e.g. if you were looking at data about football you may use ‘team’ instead of the original term ‘club’).
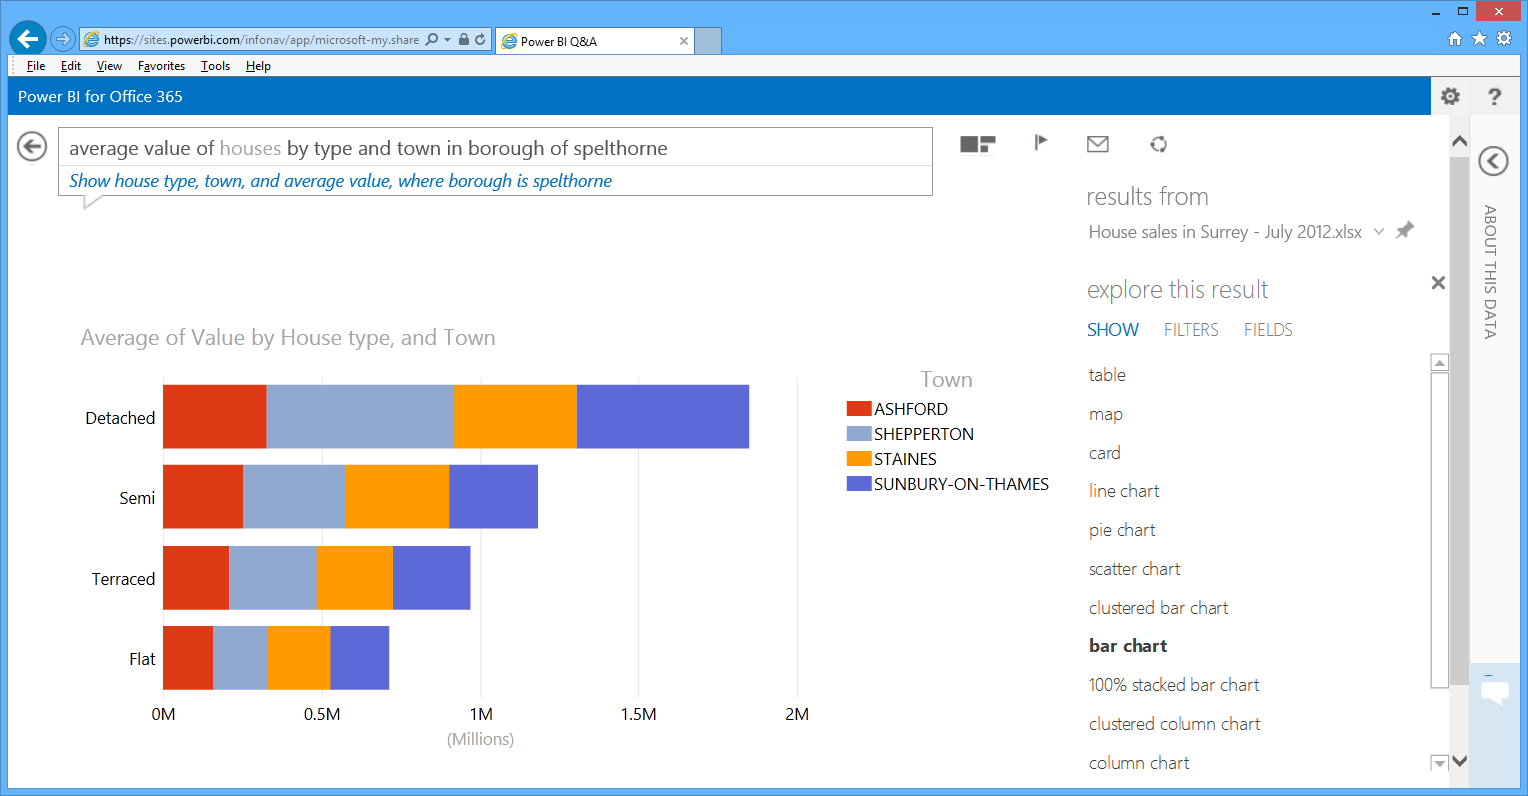
Once invoked you can type in a ‘question’ – for example, I obtained some house sales data from the Land Registry site and can ask questions such as:
houses in Camberley greater than 500000 and type is detached
value of houses by type in esher and weybridge and camberley
average value of houses by type and town in borough of Spelthorne
You’ll notice in the first screenshot that there are some featured questions – these can be easily be added to the ‘gallery’ for repeated quick access (and it’s a useful tool to ask a question and then tweak the values).
Hi there,
Is this available for UK office 365 customers?
Hi David, yes it is.