My previous post on composite applications turned out to be a bit of a mix-up because composite application guru Bob Balfe spotted that although I was using the new view container, I was still defining the wiring properties the old way. The good news is that now I’ve found out how to do ‘the new way’ it’s even easier.
So, today’s lesson in composite applications involves taking Notes data and pulling it into a Symphony spreadsheet, all within the neatly-packaged environment of a Notes 8.5.1 composite application. Hang on, I hear you say, I’m an Excel user… that’s okay, the spreadsheet can be an Excel file. Right, propeller hats on? Then we shall begin.
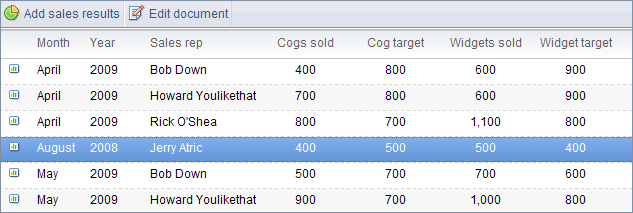
Like our last lesson, you’ll need to start with a standard Notes database with a view and a form. For my demo application I picked a scenario that would fit nicely into a spreadsheet, but would also let Symphony do a few extra calculations and display a chart. So mine contains the name of a sales rep, month and year, and targets and actual sales figures for cogs, widgets and bolts. The details aren’t too important but you should make sure that all of the fields you want to use are added to the view. Bear in mind also that you can do the whole thing in one NSF created as a composite application, or you can start with a standard Notes database, then create a new blank composite application and pull the design elements in. I did it all as one application. You’ll also need to create a spreadsheet – design it so there’s places for the data to sit and set up the chart in advance.

Assuming you now have a composite application and the form and view ready (don’t forget to add some data), edit the composite application and pull a Notes View Container from the Component Library palette onto the blank application. Edit the properties of this component – under Component Settings select the view from your Notes database and set the rendering technology to ‘Java’. Press OK and let the view appear.
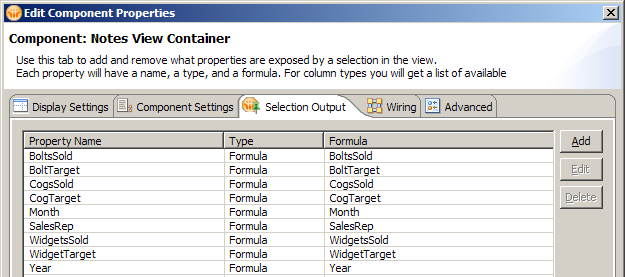
Open up the Component Properties again and go to the Selection Output tab to declare the data that you want to pull from the view into the spreadsheet. Add a new property, name it (e.g. Month for the first one), select ‘Formula’ as the type, and then in the Formula column select the Notes view column to grab the data from. Add another property, and repeat until you’ve included all of the Notes view columns. At this point you can go to the Advanced tab and check that all of these new assignments are set to be wireable – by default they should be. Click OK.

Now you can add a Symphony Spreadsheet Container – drag it into the application workspace, place it wherever it will fit best and open the Component Properties. Set the name of the spreadsheet file (including the path) and click OK. Now comes the clever bit… we’re going to specify where the data from the view is going to land on the spreadsheet, and this involves the bar along the top of the Spreadsheet Container. For each data element specify a name and then the cell where the data will land, and then click the cog-shaped button. It will look like this…

Repeat for all of the values. After doing this, look at the Component Properties and go to the Landmarks tab – you’ll see all of your new landmarks created and listed. All that needs to be done now is to wire the two containers together. Click on the yellow plug icon at the top of the Notes View Container. Select your first available property (say SalesRep) – the target component will already say Symphony Spreadsheet Container – set the action to ‘Set SalesRep’ and click Add Wire. Repeat for all of the properties, then click OK.
 That’s it… you can now tidy up with page names and making sure your spreadsheet looks okay. In true Blue Peter tradition (us Brits will understand that), here’s one I created earlier with not a scrap of sticky-back plastic in sight… click on the image.
