In an attempt to completely alienate everyone who just comes to dadams.co.uk for humour and pedantry, here is the third part of our look at Notes 8.x composite applications. Our previous look at integrating Symphony spreadsheets with a composite application was a simple example publishing individual field values. Today we’ll get a little more complex. Just a bit. Please note that this example is hopelessly ripped off from this article from the Composite Application wiki – I make no apology for that as I’ve learnt some things by following that example and building my own.
This example features an employee database with the following details can found in the form and view:
- Employee name
- Country (set to a choice of England, Scotland, Denmark, Finland, Norway and Sweden)
- Department (Sales, Marketing, Finance and Technical)
- Age
- Salary (recorded in $s to keep it uniform across the countries)
As in the last example I created a blank composite application and then added one form and one view, so basic stuff to this point. I then added a variety of records to bring into the results in the Symphony spreadsheet (which I also needed to create and make available in the file system). The spreadsheet itself can be modified as you build the composite application, there’s no need to do everything up-front. I created individual sheets to hold a table of Notes records, analysis of salaries and ages (maximums, minimums, averages and the size of the record sample), and counts of how many employees in each country and department – and then set up charts to show the results graphically.
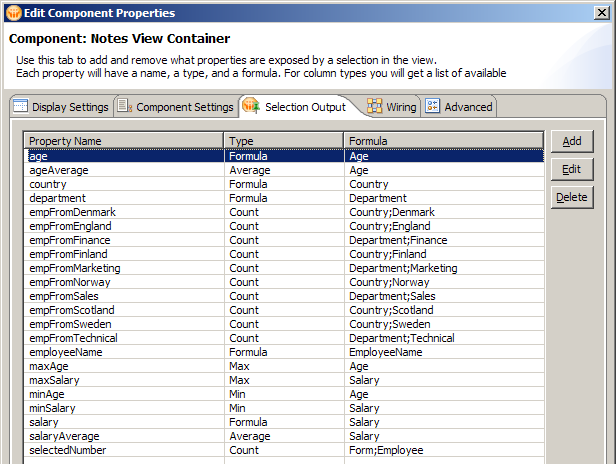
As before, open the application in the composite application editor and drag in a Notes View Container – edit the component properties to select the view and set it to Java rendering. Then drag in a Symphony Spreadsheet Container and set the initial file to be the spreadsheet created earlier. Now, as in the previous example, we need to set the Selection Output from the Notes view – the difference this time is that we’ll be using some functions as well as straight field values. For example, we’ll be counting the employees from each country and department, and finding the minimum, maximum and average ages and salaries… like so:

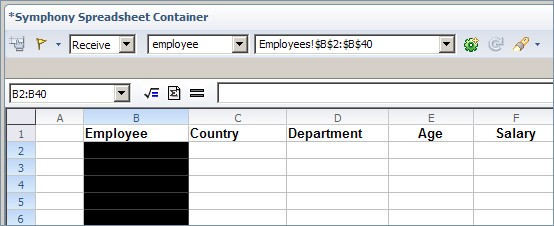
Next we will decide where the outputs will sit in the Symphony spreadsheet. This is no different to the previous example – using the toolbar at the top of the Spreadsheet Container to assign the landmarks – apart from one clever trick. In this example we’ll be able to select multiple Notes records and see them reflect in Symphony. This is what creates the sample to find minimums, maximums and averages, and counts from the sample. These landmarks are created in the same way as before, the results landing in one cell each. But the data table needs to repeat, a spreadsheet row for each Notes record. To make this happen, for each Notes field you need to select a range… the values will then list downwards. Repeat for each of the available fields.

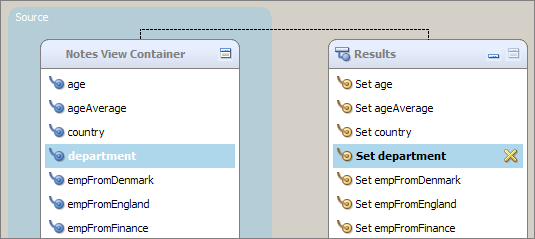
After setting up the Spreadsheet Container you just need to wire the two components together, as in the previous examples. This can be done via the dialog boxes, although with the greater number of wires required in this example it may be quicker to use the drag and drop functionality of the wiring view.

With the wiring done your application is finished, bar the finishing touches of page titles, icons and final layout of the spreadsheet. In previous posts I omitted details of how to set an application icon. This is easy to do, simply add a 16×16 .PNG image as a resource using Domino Designer. You can then edit the properties of the composite application and select the image. Bear in mind that if your composite application has multiple pages you can set an icon for each page.
 Here endeth the lesson. As always, here’s a finished application (note the customised icon breaking the 16 colour limit of a standard Notes application icon) – just click on the image to reveal the big picture.
