
In late December I blogged about the Power Query add-in for Excel 2013, and mentioned that Excel is an important part of Microsoft’s strategy for Business Intelligence. BI in general is very much a hot topic in customer conversations. Power BI for Office 365 recently became available, and I’ll cover that in detail another time, but now we’re going to take a look at the Power BI app for Windows 8.1.
 As I mentioned before, Excel’s Power tools take care of the various stages of BI, and Power View is the tool that allows you to present, view and explore the data. You can view the Power View dashboards is in Excel itself, but Microsoft are delivering other methods. Power BI for Office 365 will allow users to view a Power View dashboard in a browser, and this experience is enhanced with added support for HTML 5.
 The Power BI app for Windows 8.1 accesses an Excel spreadsheet in a shared place (e.g. a SharePoint document library or OneDrive) and displays the ‘presentable’ BI content – that will be data tables, pivot tables, charts and Power View dashboards. Click on the images to see the larger versions.
So, consider this scenario… the busy executive walks into a meeting with his (or her) Windows 8.1 tablet, loads the Power BI app, views the available reports, selects a dashboard to view, and then explores, filters and drills down into the data. This is made easy by the app’s touch interface. It’s also easy to browse an entire SharePoint library, select an Excel spreadsheet, and mark it as a favourite so that it appears in the app’s home screen.
The two images below show the same Power View dashboard – the panel containing the filters is open on the right, but in each image an aspect of the data is selected to show the impact of that data. In the first example, Q4 is selected in the bottom-right chart, and the data represented by Q4 is shown on the other charts (I love the way the pie chart slices shrink). In the second example, ‘Software’ is selected in the pie chart and again, the other charts show how that revenue category is represented in the other charts.

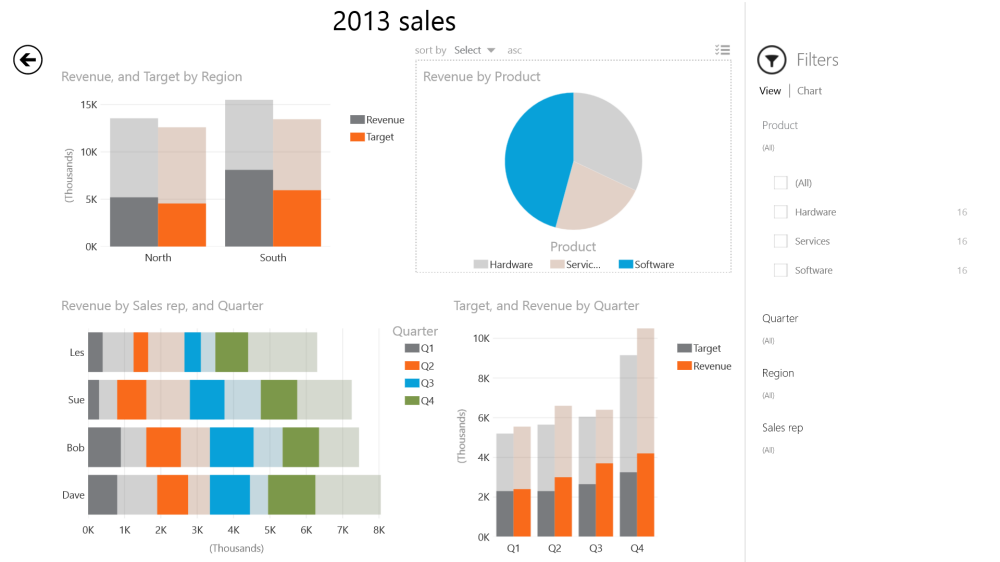
The app supports all of the visual elements provided by Power View, with the exception of animated time-based bubble charts (you’ll have to stick to static bubble charts for now).
Power BI is available to download from the Windows app store, and after installing it you’ll see that there are some sample dashboards to try out.
Data can be from other sources too – here’s a tutorial using MongoDB, Windows Communication Foundation, OData, and PowerBI to build a Business Intelligence solution on Windows Azure: http://msopentech.com/?p=853801